
Post-Trade Analysis - PEGA
I have not shared a PTA in quite some time. I used to dilligently perform PTAs for all my trades and share them on Twitter for all the world to see: the good, the bad, and the ugly. With the launch of this personal blog site, I can create much more lengthy posts and talk about my thought process for the trade. If you care to share any feedback on my trade, my thought process, or anything else, please hit me up using the blue bird.
My approach to trading has changed significantly since I last shared a PTA. Brian Shannon from Alphatrends has greatly influenced my approach. Where I used to look for longer-term position trade setups and occasionally perform some shorter-term swing trading around a core holding, these days I focus on ST swing trading setups that may become LT positions if the market allows. I start with a large position size, max 20% of my account. I sell 1/3 of the initial position into ST strength, quickly locking in a profit to help reduce overall risk. Half of the remaining shares either get sold into another burst of ST strength or stopped out on an undercut of a ST higher low. The remaining shares I will aim to keep as a LT position. I raise the stop on the remaining shares to my break-even point where it remains until the stock forms a LT higher low above my break-even. That higher low will act as the new stop.
Brian has written two excellent books on technical analysis. His first book, Technical Analysis Using Multiple Timeframes changed the way I look at charts. I no longer look for the classic IBD-style patterns such as a cup with handle or a double bottom. The book explains the psychology underpinning the patterns based on market strcture. With that understanding, patterns become more of a meta concept: a visual cue to help quickly spot changes in supply and demand. Brian’s approach starts with looking at a stock across…you guessed it…multiple timeframes. The edge comes from trend alignment across multiple timeframes.
Brian’s latest book, Maximum Trading Gains With Anchored VWAP, brings a truly innovative approach to technical analysis using AVWAP as an ideal indicator combining the three most important variables in technical analysis: price, volume, and time. It functions as the perfect objective sentiment indicator across all timeframes. From any particular point in time (the anchor), a rising AVWAP indicates buyers in control (excess demand) where a falling AVWAP indicates sellers in control (excess supply). With price above the AVWAP, it tells us that the average long position from that point remains profitable. With price below, the average short position remains profitable.
With that background, let’s look at my trade in Pegasystems, Inc (PEGA). It was a losing trade, and I could have done better on the execution. We do PTA for exactly this reason: to learn from our mistakes, replicate our successes, and continually improve.
The chart below for PEGA shows 4 different timeframes at the time of my entry. Brian’s first book describes using at least 3 different timeframes to gauge the LT primary trend, IT secondary trend, and ST swings. If we want to look for position trading setups, we start with the weekly for LT, daily for IT, and 30m for ST. For swing trading setups, we start with the daily for the LT, 30-min for IT, and 5-min for the ST. Showing 4 timeframes gives me a quick glance at setups for swing and position trading. Each timeframe shows three moving averages: ST (red), IT (blue), and LT (green).
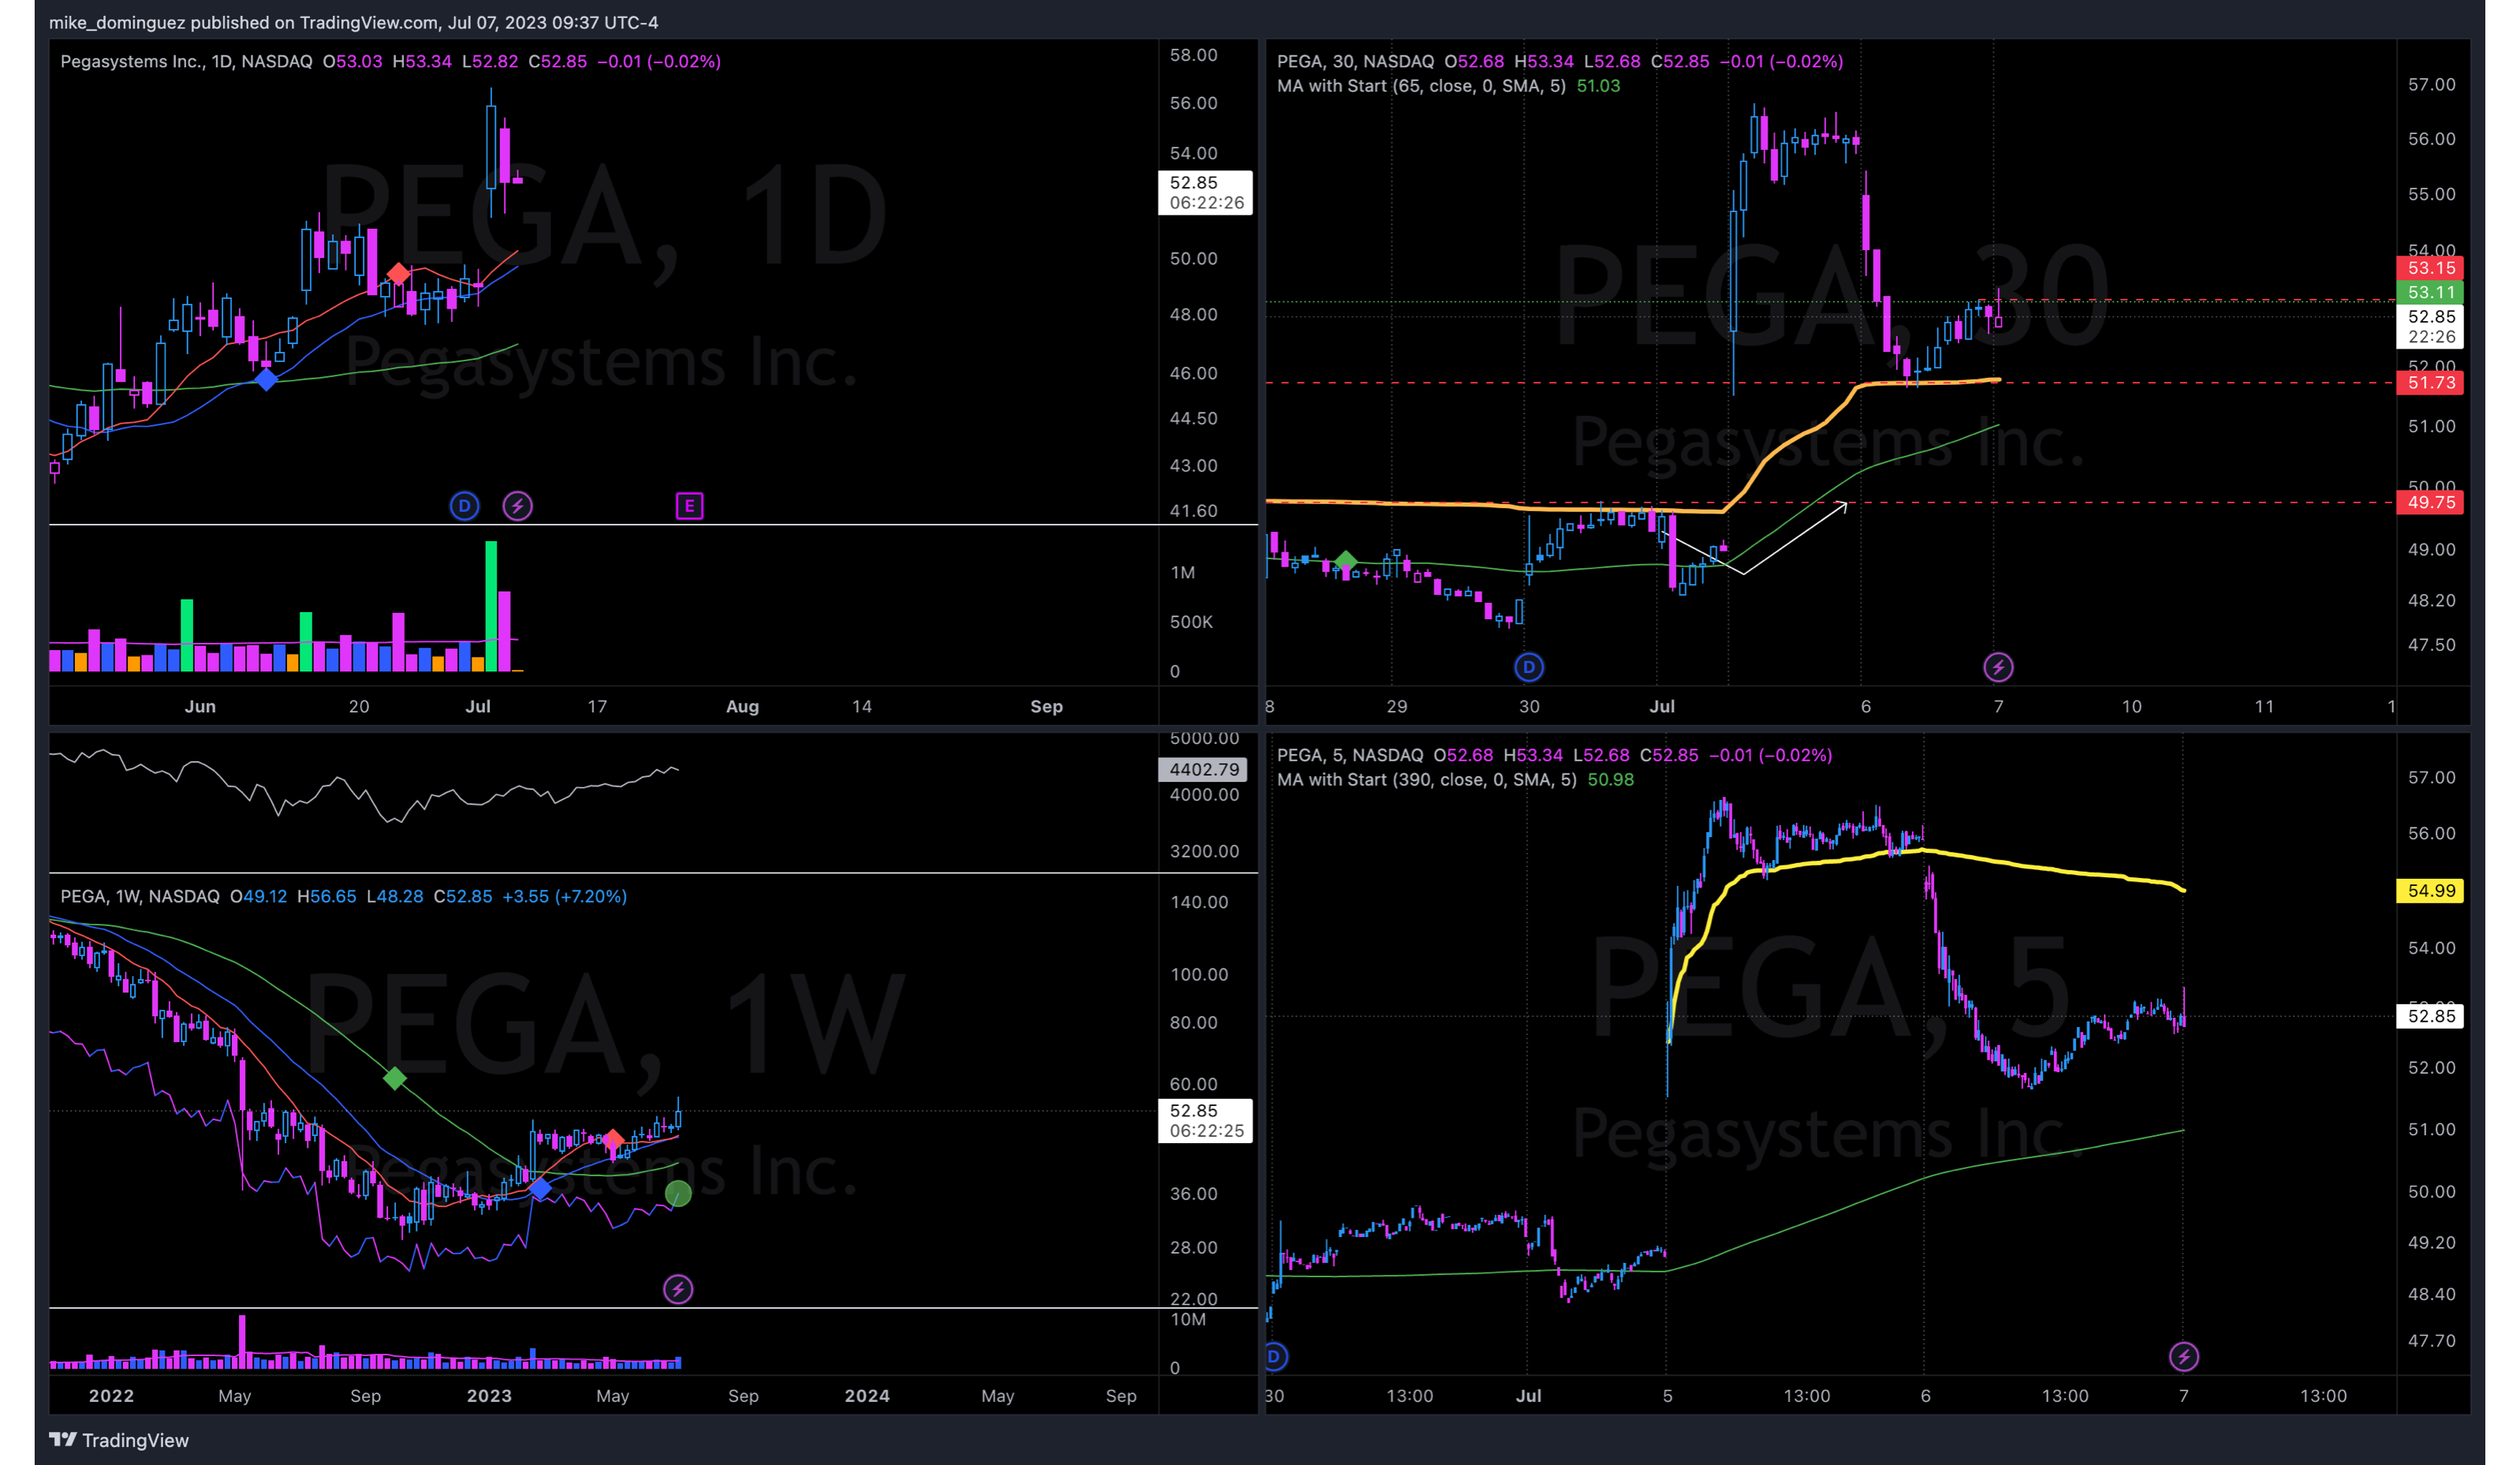
The weekly chart shows the stock in early Stage 2 markup exhibiting a pattern of higher highs and higher lows above rising key moving averages stacked ST>IT>LT. The RS Line is leading price to new highs. To my eye, I see a stock with LT upside potential. The daily shows an established Stage 2 markup phase with higher highs and higher lows above rising ST>IT>LT moving averages. 30-min chart shows the stock pulling back after gapping up above a ST resistance area around $49.75. It tested an AVWAP anchored to June 13 opening gap where it found support.
I bought at the open during the first 5 minutes as the stock retook the daily AVWAP and broke past ST resitance area. The 5-min chart below shows the entry.
I probably should have waited for the market to calm a bit after the open, becuase the stock reversed on that first 5 minute bar, undercut the higher low from the prior day’s close and gave up the daily AVWAP, as illustrated on the chart below. I decided to close with a small loss.
- -1.25% loss
- -$0.67/share
- -0.26% total equity.
Often that would signal the end, and I would usually move on to the next stock to trade. I watched it setup again on the ST timeframe and decided to take another swing as the stock retook a flattening daily AVWAP with a stop at the low of the day.
The stock acted like it wanted to make some headway above the daily AVWAP but just couldn’t hold it. The major indexes all faded hard into the close, roundtripping all their gains. I didn’t want to hold a loser over the weekend, so I closed the trade with another small loss.
- -1.54% loss
- -$0.82/share
- -0.30% total equity
I should not have gotten so agressive on Friday last week, particularly as the major indexes started to fade and give up all their gains for the day. That said, the losses fell well within my own risk tolerance. Keeping losses small ensures we survive to trade another day.